
The Desk Members toolkit
Model-driven tools for medium- to long-term bitcoin and treasury-company holders: see where the cycle sits, build your own composite, write your own entry and exit plan, and test it against history.
Built for long-term holders. No leverage. HODL, macro entries and exits, or a hybrid of both.
…
Strategy figures from strategy.com (primary source) and SEC filings. Official channels: @Strategy · @saylor · michael.com. Education only, not investment advice.
Unlock the Members desk free with your email
One email, instant access, remembered in this browser. No password, no repeat signup.
- Signal Zones: the whole cycle in color
- Model Builder: your own composite
- Entry & Exit Planner, your rules
- Strategy Lab: DCA vs zones vs lump sum
- Freedom Plan: when could you reach your goal?
- Momentum & Trend grid (W / M / Q)
- mNAV Radar & BTC Yield tracker
- Cycle Clock & halving countdown
- All 7 Desk Library PDFs + Saylor Quotes bonus
Already a member? Sign in. New here? See the plans.
See membership- Loading…
Composite of Power Law position, MVRV proxy, Mayer Multiple, 200-week MA and Pi Cycle, equal weights, 7-day smoothed. Each day is ranked only against the days before it, so past zones use no hindsight. Zone markers use a small buffer so they don't flicker.
Model read. Education only, not investment advice.
Model read. Education only, not investment advice.
| Band | Days | Avg 1Y fwd | Median | % positive |
|---|
Past performance, not a forecast. Overlapping 1-year windows from {start} on, so days are not independent; one cycle can dominate a band.
Timing layer (optional, daily)
A timing aid only, used inside the long-term plan above: it never fires on its own.
Your plan, your rules. Model read. Education only, not investment advice.
Markers show the first day a condition became true, then at most once per 90 days per condition (long-term pacing). mNAV conditions are checked live only: there is no verified mNAV history here.
Model read. Education only, not investment advice.
| Strategy | Invested | Final value | Units held | Cash | Multiple | Max drawdown |
|---|
Monthly contribution on the first trading day of each month, at that day's close. No fees, taxes or slippage. Zones come from the BTC composite (no hindsight). Max drawdown = worst fall in account value from a prior peak. Stocks: split-adjusted closes.
Assumes treasury stocks move with BTC at today's mNAV (no change in mNAV or BTC per share), preferreds hold their price and pay the yield you set, dividends are reinvested into preferreds until the target year. No taxes, fees or inflation.
Scenarios, not predictions. Education only, not investment advice.
| Scenario | Goal reached | Value at target date | Pref. income / mo at target | Income covers expenses |
|---|
Each cell counts four checks for that timeframe: RSI(14) above 50, MACD(12,26,9) histogram above zero, 12-period rate of change above zero, close above its 10-period average. Green = 3 to 4 positive (trend up), amber = 2 (mixed), red = 0 to 1 (trend down). Cross status uses the daily 50 and 200-day averages.
Model read. Education only, not investment advice.
The chart loads after you unlock.
TradingView chart with RSI(14), MACD(12,26,9), Bollinger Bands(20,2) and a simple moving average preloaded (set its length to 50 or 200 in the chart; the free widget can't preset it, and the 50/200 cross is in Momentum & Trend). Weekly by default; daily and 4H are for timing inside a long-term plan.
Model read. Education only, not investment advice.
Model read. Education only, not investment advice.
| Company | mNAV | BTC/share growth |
|---|
mNAV = market value vs the bitcoin it holds; methods differ by source. BTC per share growth only where filings give both BTC held and share count.
Model read. Education only, not investment advice.
BTC Yield = % change in BTC per (assumed diluted) share over the period. It is a company KPI, not a return on the stock.
Model read. Education only, not investment advice.
Next halving at block 1,050,000. Date estimated from the current block height at 10 minutes per block, so it drifts by days. Past cycles are only four data points.
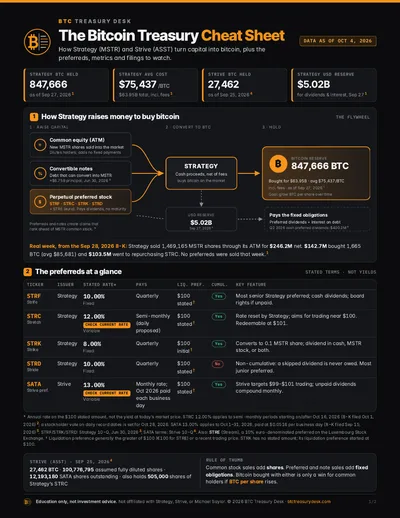 Bitcoin Treasury Cheat SheetTwo-page PDF · PDF
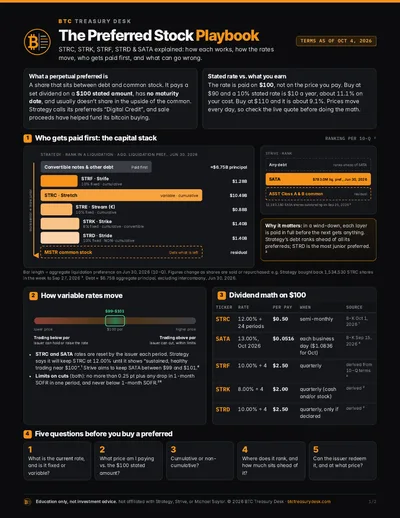 Preferred Stock PlaybookSTRC, STRF, STRK, STRD, SATA · PDF“”Greatest Saylor QuotesBonus · PDF
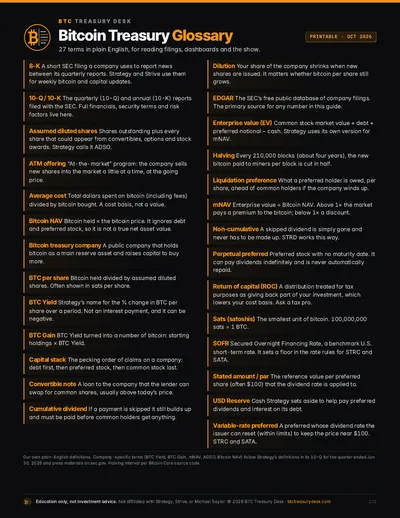 GlossaryEvery term, one page · PDF
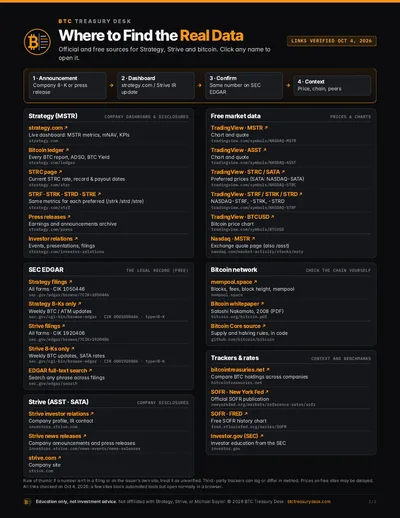 Where to Find the Real DataData sources sheet · PDF
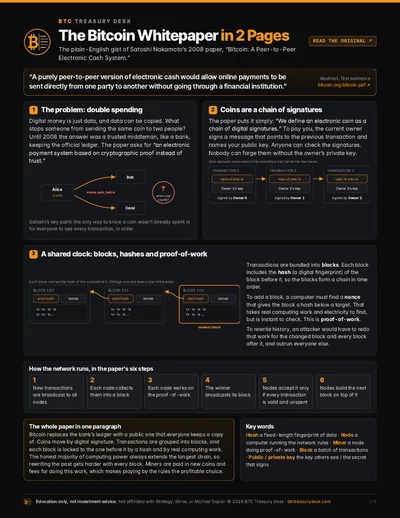 Bitcoin Whitepaper in 2 PagesThe original, condensed · PDF
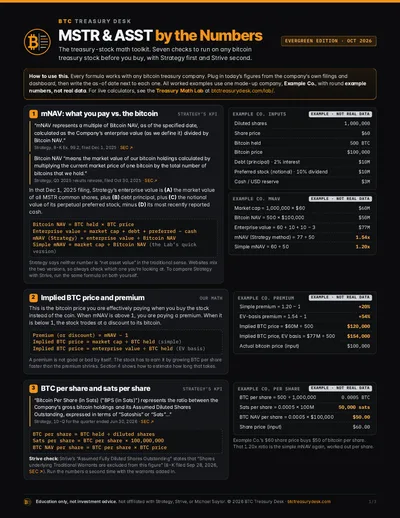 MSTR & ASST by the NumbersHoldings, shares and preferreds · PDF